Etiquetado: diets
Bad nutritional science (II)
Some time ago I wrote a critique («Bad science«) of a meta-analysis that analyzed the effectiveness of low-carb diets, entitled “Low Carbohydrate versus Isoenergetic Balanced Diets for Reducing Weight and Cardiovascular Risk: A Systematic Review and Meta-Analysis“. That blog entry was one of the most visited pages of this blog in year 2014.
At the time I checked a few, not all, of the original data sources used in the meta-analysis, finding several blatant «mistakes» (were they really «mistakes»?). We found mistakes in Figure 3 and we found that the most influential data of Figure 4, from Sacks 2009, was reversed: it should favor low-carb diets, and not the opposite. An important «mistake».
I would like to add a few comments on the meta-analysis and the data it uses.
Lim 2010
Out of curiosity I checked another article used in Figure 4 of the meta-analysis, which is denoted as Lim 2010. Apparently in that study a «balanced» diet was better for weight loss than a «low-carb» diet.

Was it really so? I have my doubts about that.
The study is from year 2010, entitled «Long-term effects of a low carbohydrate, low fat or high unsaturated fat diet compared to a no-intervention control»
Three diets are compared with a control group. One of those diets is supposedly low in carbohydrates, the one they call VLC. The following graph shows the body weight evolution in the different groups (for the control group only only baseline and final values are shown, with a hollow circle):
 |
 |
The text at the bottom of figure 2 says one of the diets is identified with dark circles, but there are no dark circles in the graph. That makes me doubt about what curve corresponds to each diet. Fortunately, the baseline body weights for the different groups are given to us in Table 1, and they are different for each group, allowing us to identify the curves:
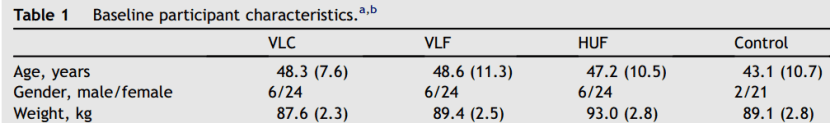
- The curve with the lowest baseline value corresponds to the VLC diet,
- The curve with the highest baseline value corresponds to the HUF diet, and
- The curve with a baseline value similar to that of the control group is the VLF diet.
Therefore, in the figure, the total change in body weight experienced with the VLC diet (the one supposedly low-carb) corresponds to the red straight line. The other two diets correspond to the blue (HUF) and green (VLF) straight lines.

What diet produced a bigger weight loss? Apparently that was the VLC diet, the one with a more negative slope. That doesn’t match the data included in the meta-analysis:
The origin of the discrepancy is that Lim et al. gave three different versions of the results: a) the one we have seen in Figure 2, b) what they say in the text of the article and c) data from Table 3.
In Table 3 we are told is the HUF diet the one that resulted in more weight loss after 15 months.

And the values in the text are also different and clearly wrong, at least in the error values (0.1 and 0.01 kg?):
The estimated weight change from baseline to 15 months was 3.0 ±0.2 kg for VLC, 2.0 ±0.1 kg for VLF, 3.7 ±0.01 kg for HUF.
These standard deviations values of 0.1, 0.2 and 0.01 kg can also be found in the abstract of the article. They are clearly wrong.
What data do we believe? data from the graph, from the table or from the text? At least two of these three sources are wrong. Perhaps all of them are wrong. The authors of the meta-analysis chose the data from table 3, but in my opinion, in the absence of an explanation, Lim 2010 data is useless.
I don’t understand why only data from the HUF diet, the one supposedly better than the VLC diet (according to table 3), was included in the meta-analysis, but not data from the VLF diet, the one supposedly worse than the VLC diet (according to all the sources), although the percentages of macronutrients of the VLF and HUF diets are very similar. Even if we believe data from table 3 is the data without errors and data from Figure 2 and from the text are wrong, the VLC diet would be as good as the other two diets, if both of them are considered. But, I insist, the VLC diet is the best if we use data from Figure 2.
Moreover, the VLC diet was hardly a low-carb diet, with a percentage of kcal from carbohydrates that increased as time went by. It was only really low-carb at the beginning of the study:


For example, at 15 months 0.365 * 1635 kcal = 597 kcal, what gives us 149 g of carbohydrates. Too many carbs for a low-carb diet.
Do we link the result of this study to a low-carb diet, when in fact the participants didn’t follow a low-carb diet? That is actually the main flaw of the meta-analysis (apart from all the errors we found in the data, which coincidentally always make low-carb diets’ results seem worse), that the authors consider as «low-carb diet» a diet that people who follow low-carb diets wouldn’t say are low-carb. That mistake creates misinformation.
On the other hand, the diets were supposedly isocaloric, but the reality is that the VLC group (red curve) had a caloric intake bigger than the HUF group (blue curve). The diets were NOT isocaloric. Values shown in kcal/day for 3, 6, 9, 12 and 15 months.

In short,
- there are three different versions of weight loss results. At least two of these sources, or may be all of them, are wrong.
- the VLC diet was not low-carb, except for the first months
- the diets were not isocaloric, with differences in kcal/day with an order of magnitude that may have consequences in the long term. The meta-analysis is supposed to use only data from isocaloric diets.
- the authors of the meta-analysis only used data from the HUF diet, the one that they believed was better than the VLC diet. They didn’t include data in the meta-analysis from the diet that supposedly was worse than the VLC.
As a final comment on this article, if the authors of the meta-analysis had to choose between the data from table 3 , from figure 2 or from the text, among those three possibilities they chose the option more unfavorable for the low-carb diets, data from table 3. May be we can’t be blame them for not realizing the absolute disaster that Lim 2010 data was. But when processing data from table 3, without a clear reason, they only used data from the diet they thought was better than the VLC diet, ignoring data from the diet they thought was worse than the VLC diet. May be they didn’t see the inconsistencies between figure 2, text and table 3, but for sure they saw there was another diet in table 3. And they made the decision to ignore that diet.
Keogh 2007
I have doubts about another article used in figure 4 of the meta-analysis. The study has only 13 participants, Keogh 2007, but there is another one from the same authors with many more participants.
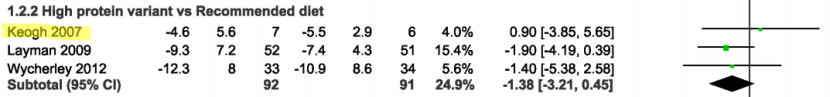
About 130 g/day of protein in the study not included in the meta-analysis, 134 g/day in the study included. Both with the same duration, 52 weeks.
The article to which I am referring is «Long-term effects of a very-low-carbohydrate weight loss diet compared with an isocaloric low-fat diet after 12 mo» (Brinkworth 2009), and there are 69 participants that completed the study, not 13. 1.9 kg of body fat were lost with a low-carb diet (LC), a real low-carb diet, with roughly the same calories than the low-fat diet (LF). More body fat loss, with basically the same calories. This article, with a mean difference between diets of 2.9 Kg in body weight and 69 participants would have had a big weight in the final result of the meta-analysis.


Diets were isocaloric, although it was not pretended. As a matter of fact caloric intake differences between diets were lower than in the study of Lim et al 2010 we analyzed before (and that study was included in the meta-analysis). In any case Brinkworth 2009 was not discarded for that reason: according to table 7 of the meta-analysis, Brinkworth 2009 is excluded because it is «Duplicate and/or complimentary», but this study has nothing to do with the studies used in figure 4. All the trials have a different registration number: therefore Brinkworth 2009 is not a duplicate nor complementary of any of them:
- Brinkworth 2009. Trial ACTRN12606000203550. E.g. 391 people responded to the announcement, 69 participants completed the study
- Wycherley 2012. Trial ACTRN12606000002583. E.g. 1150 people responded to the announcement, 68 participants completed the study
- Keogh 2007. Trial ACTRN012605000614695 (this one is the study with 13 participants)
I didn’t include Layman 2009 in the list above this line because it is an article from a different set of authors. Since the results found in Brinkworth 2009 are clearly favourable to the low-carb diet, it is impossible that the authors of the meta-analysis could think it is a duplicate/complementary of Keogh 2007. The only possibility then, is that they believe that there is a conflict with Wycherley 2012, a study with a different registration number, different number of participants and published three years later. If, for some reason I can’t see, they decided to choose between those two studies, they chose the one with a less favorable outcome for low-carb diets.
Layman 2009
Although it has no relevance, because it doesn’t affect the mean result of the meta-analysis, there is another study included in figure 4, Layman 2009, from which «intention-to-treat» (ITT) data is used, i.e. made-up data. By chance, that fact doesn’t change the difference between diets, 2 kg, but it gives a weight to this study in the computations that it doesn’t deserve, because instead of 71 participants, which is the actual data, they suppose there are 103, that are the total participants once made-up data is added. And the ITT data have a lower standard deviation than the actual data, making made-up data seem more reliable than actual data. That is outrageous!

The «intention-to-treat» philosophy, where data is made-up for non-completers, may be seen as acceptable by «scientists», but we, «normal» people, can only think of it as a joke (see).
I insist that using ITT data probably didn’t affect that much the meta-analysis result, but I want to make the point that false information is shown to us as actual data from a scientific experiment. «Intention-to-treat» data are not results from an experiment, they are a product of the authors’ imagination. It is unacceptable to use them as results from a scientific experiment.
Finally, I want to thank Andrés for his insightful suggestions.
Further reading:
